Turi Create Visualization Gallery
Click on a thumbnail to see the code and a larger image.
|
|
|
|
|
|
|
|
Examples
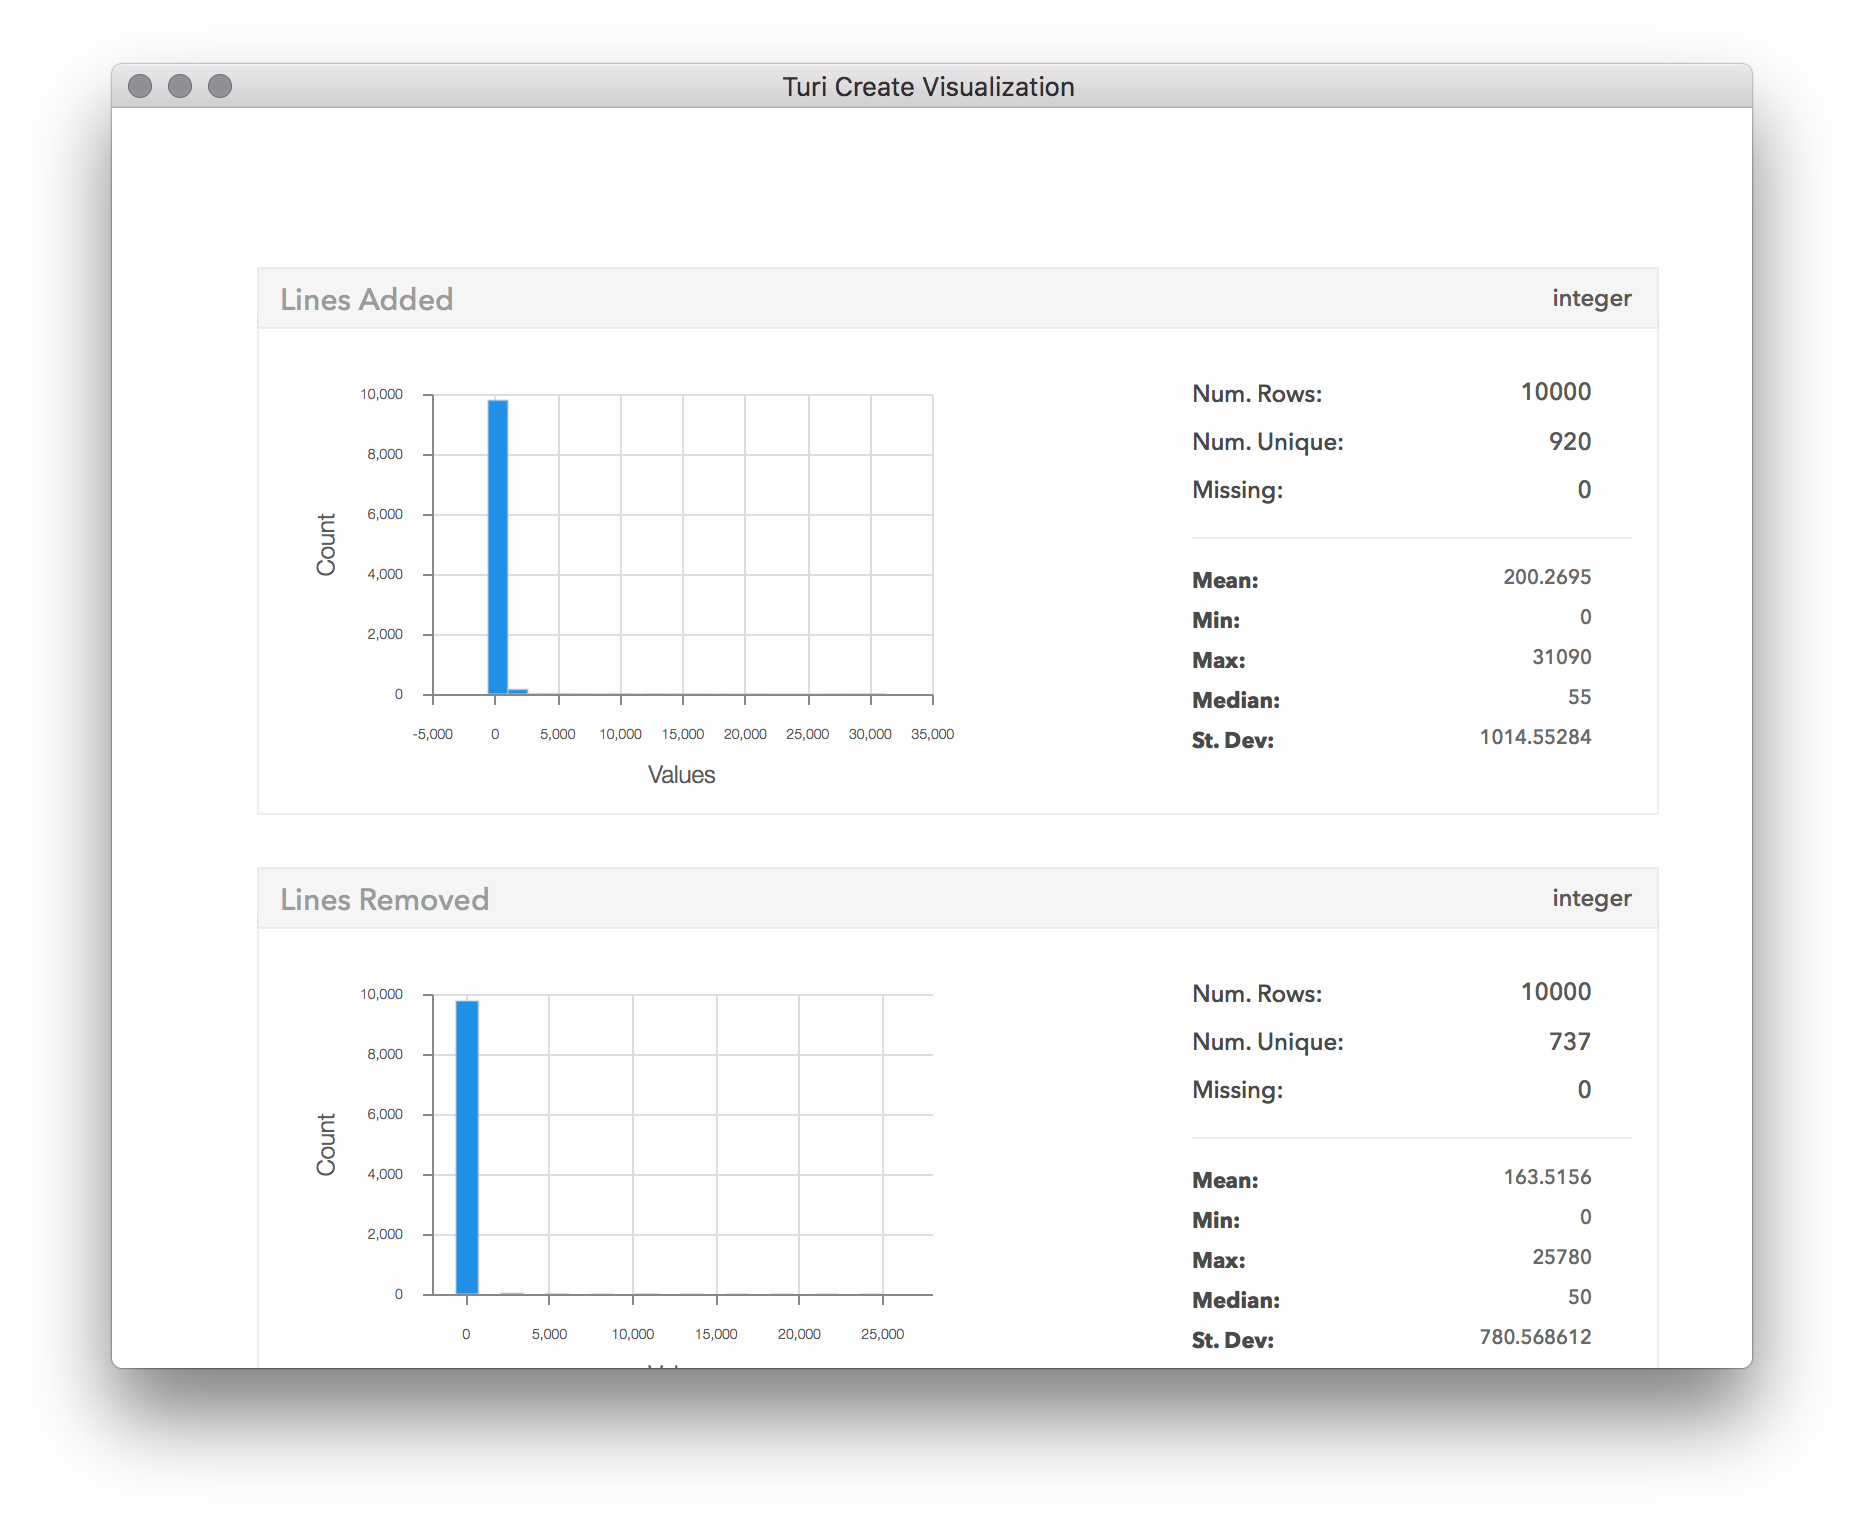
SFrame.show
# Summarizes and shows the summary of each column in sf
sf.show()
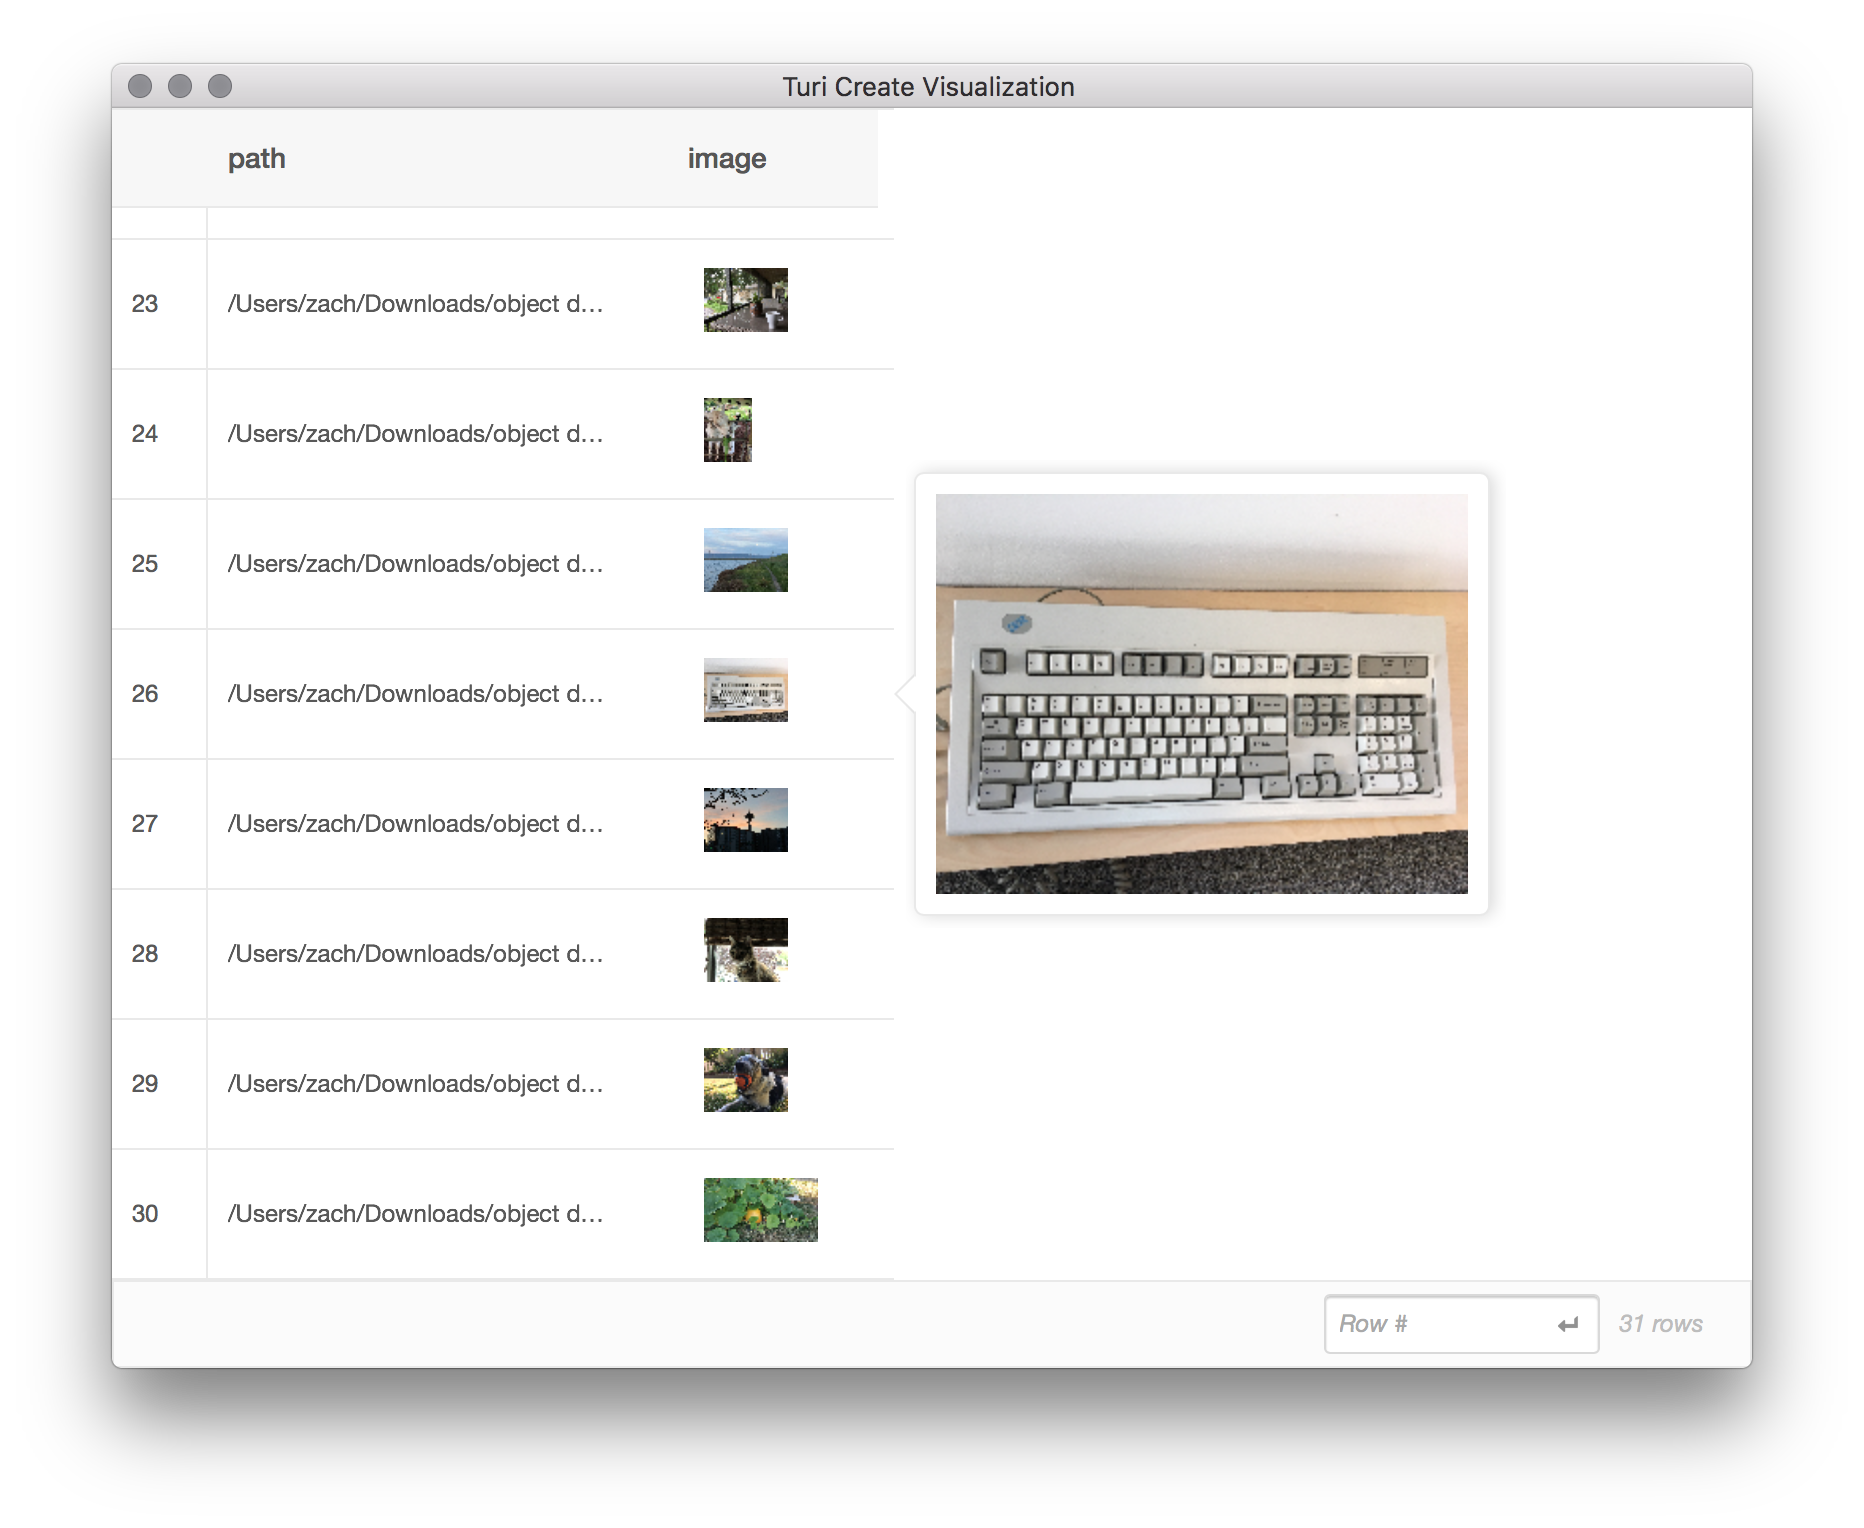
SFrame.explore
# Opens an interactive exploration of the data in sf
sf.explore()
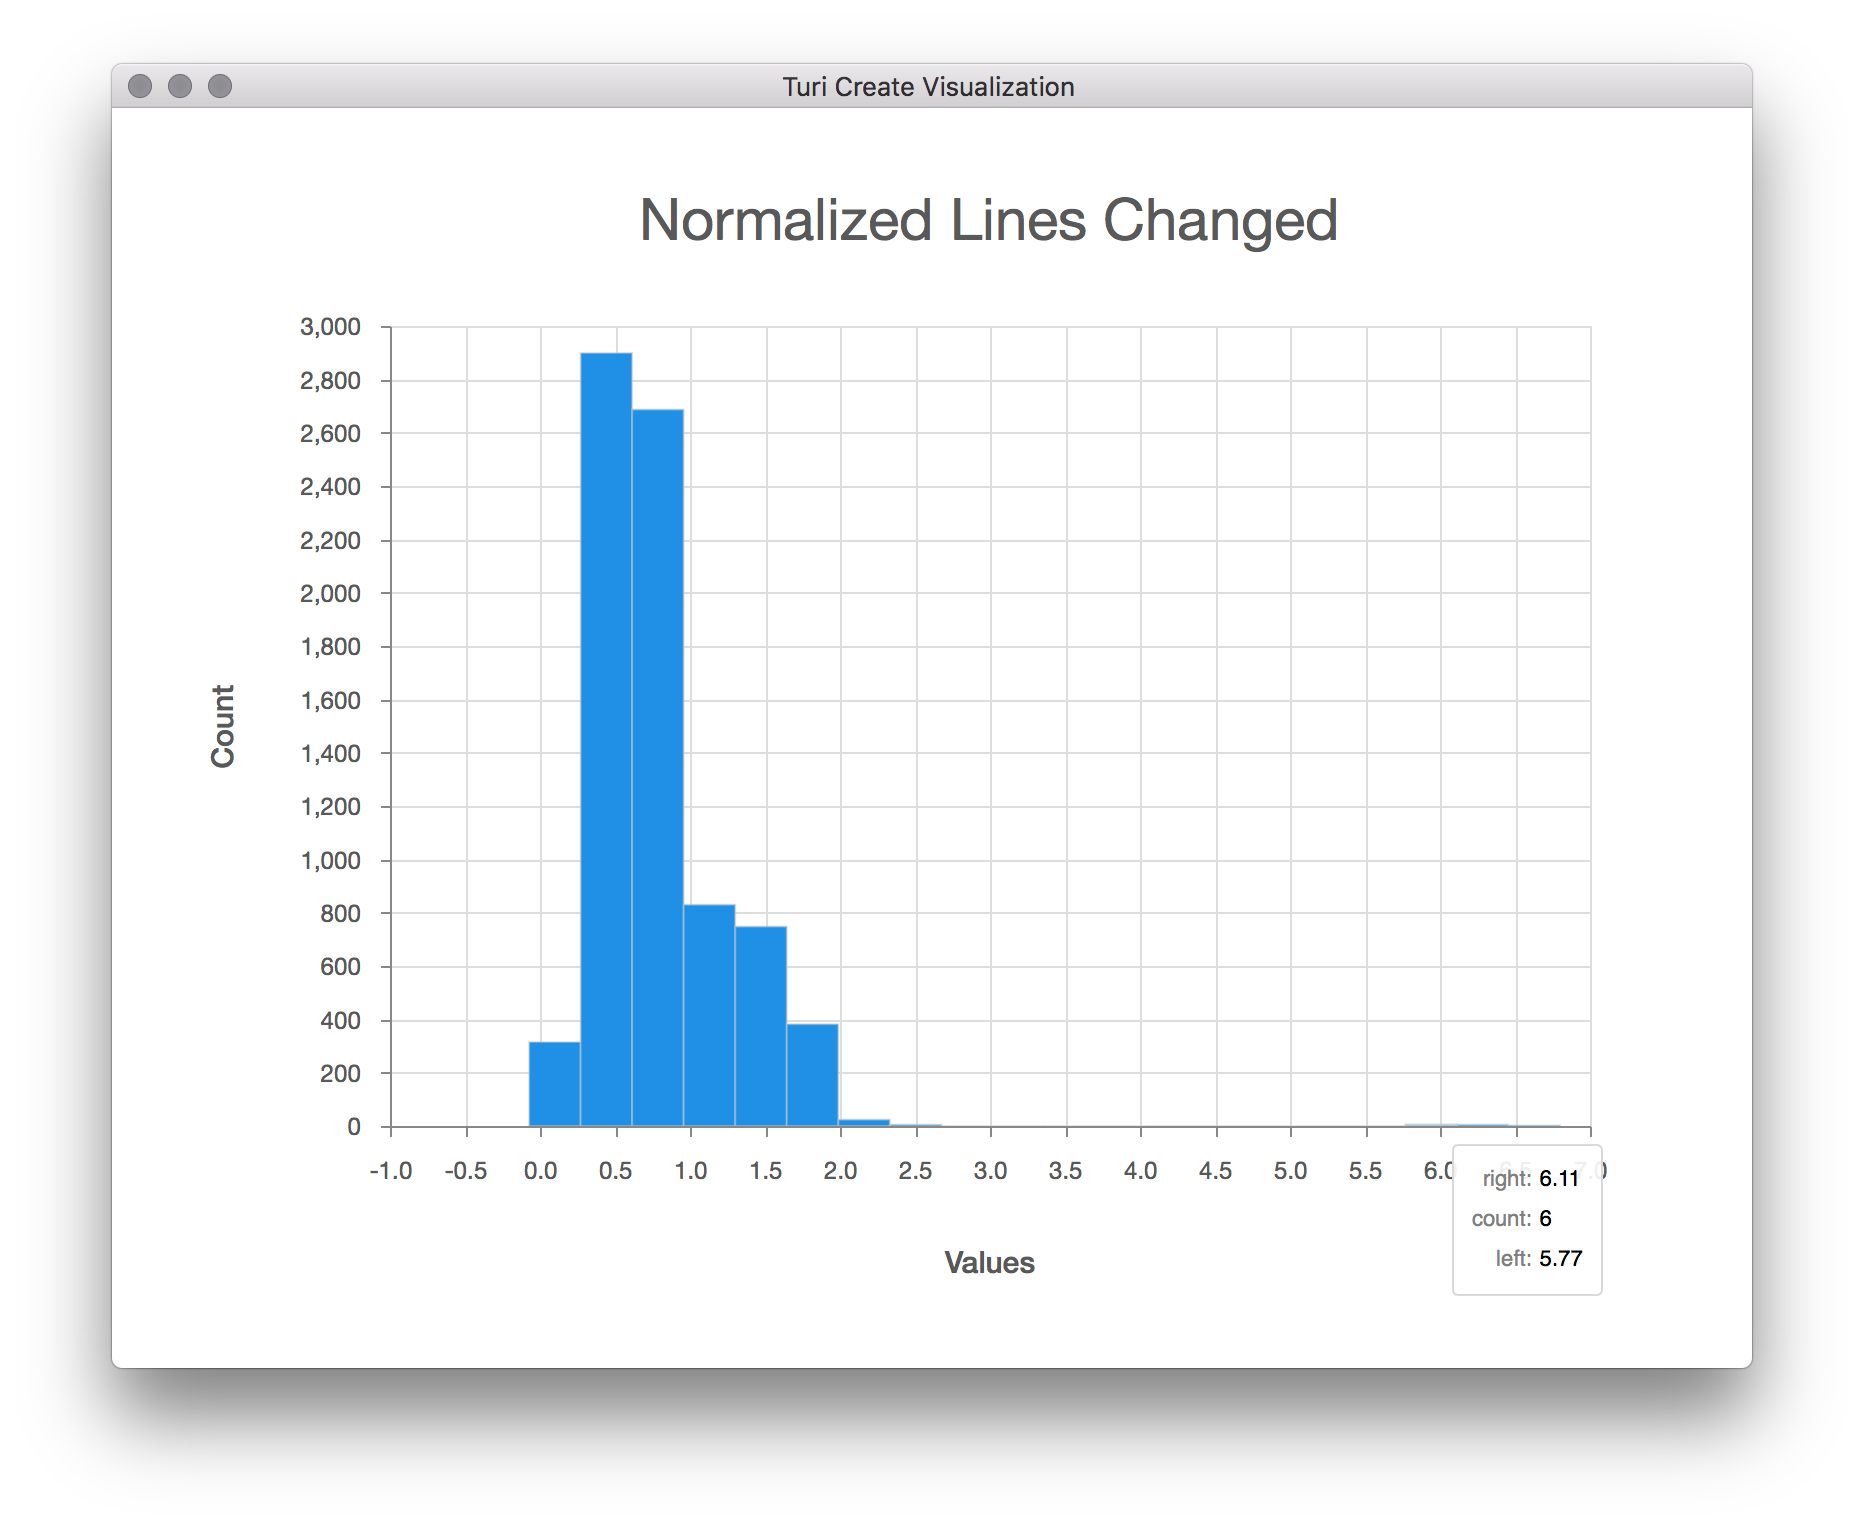
SArray.show (int/float)
# Summarizes and shows the summary of a numeric SArray
sa.show(title='Normalized Lines Changed')
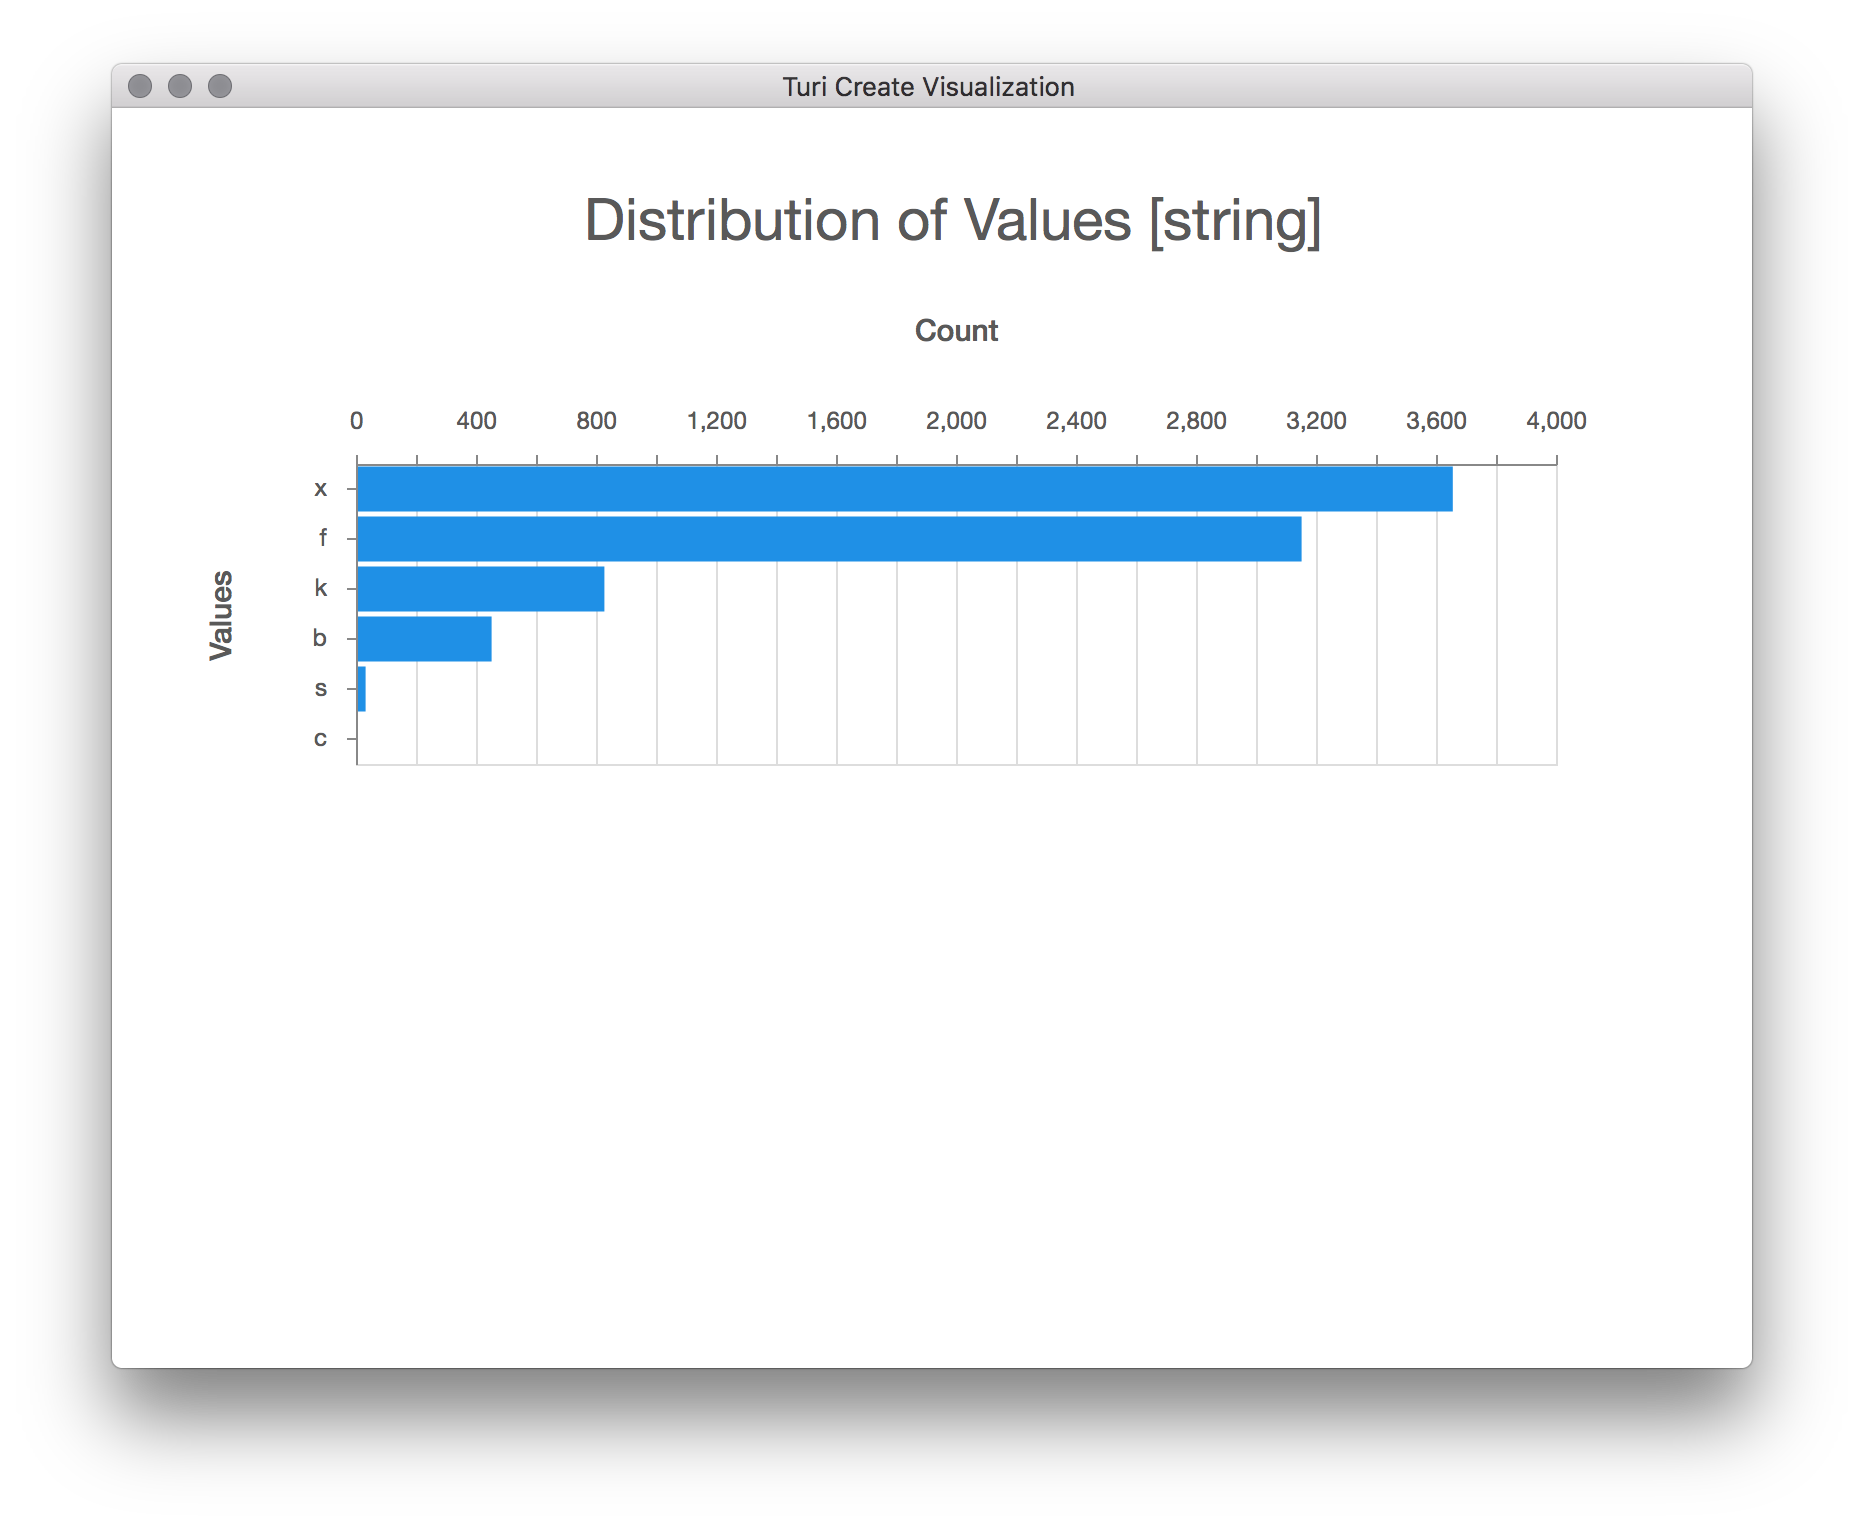
SArray.show (str)
# Summarizes and shows the summary of a categorical SArray
sa.show()
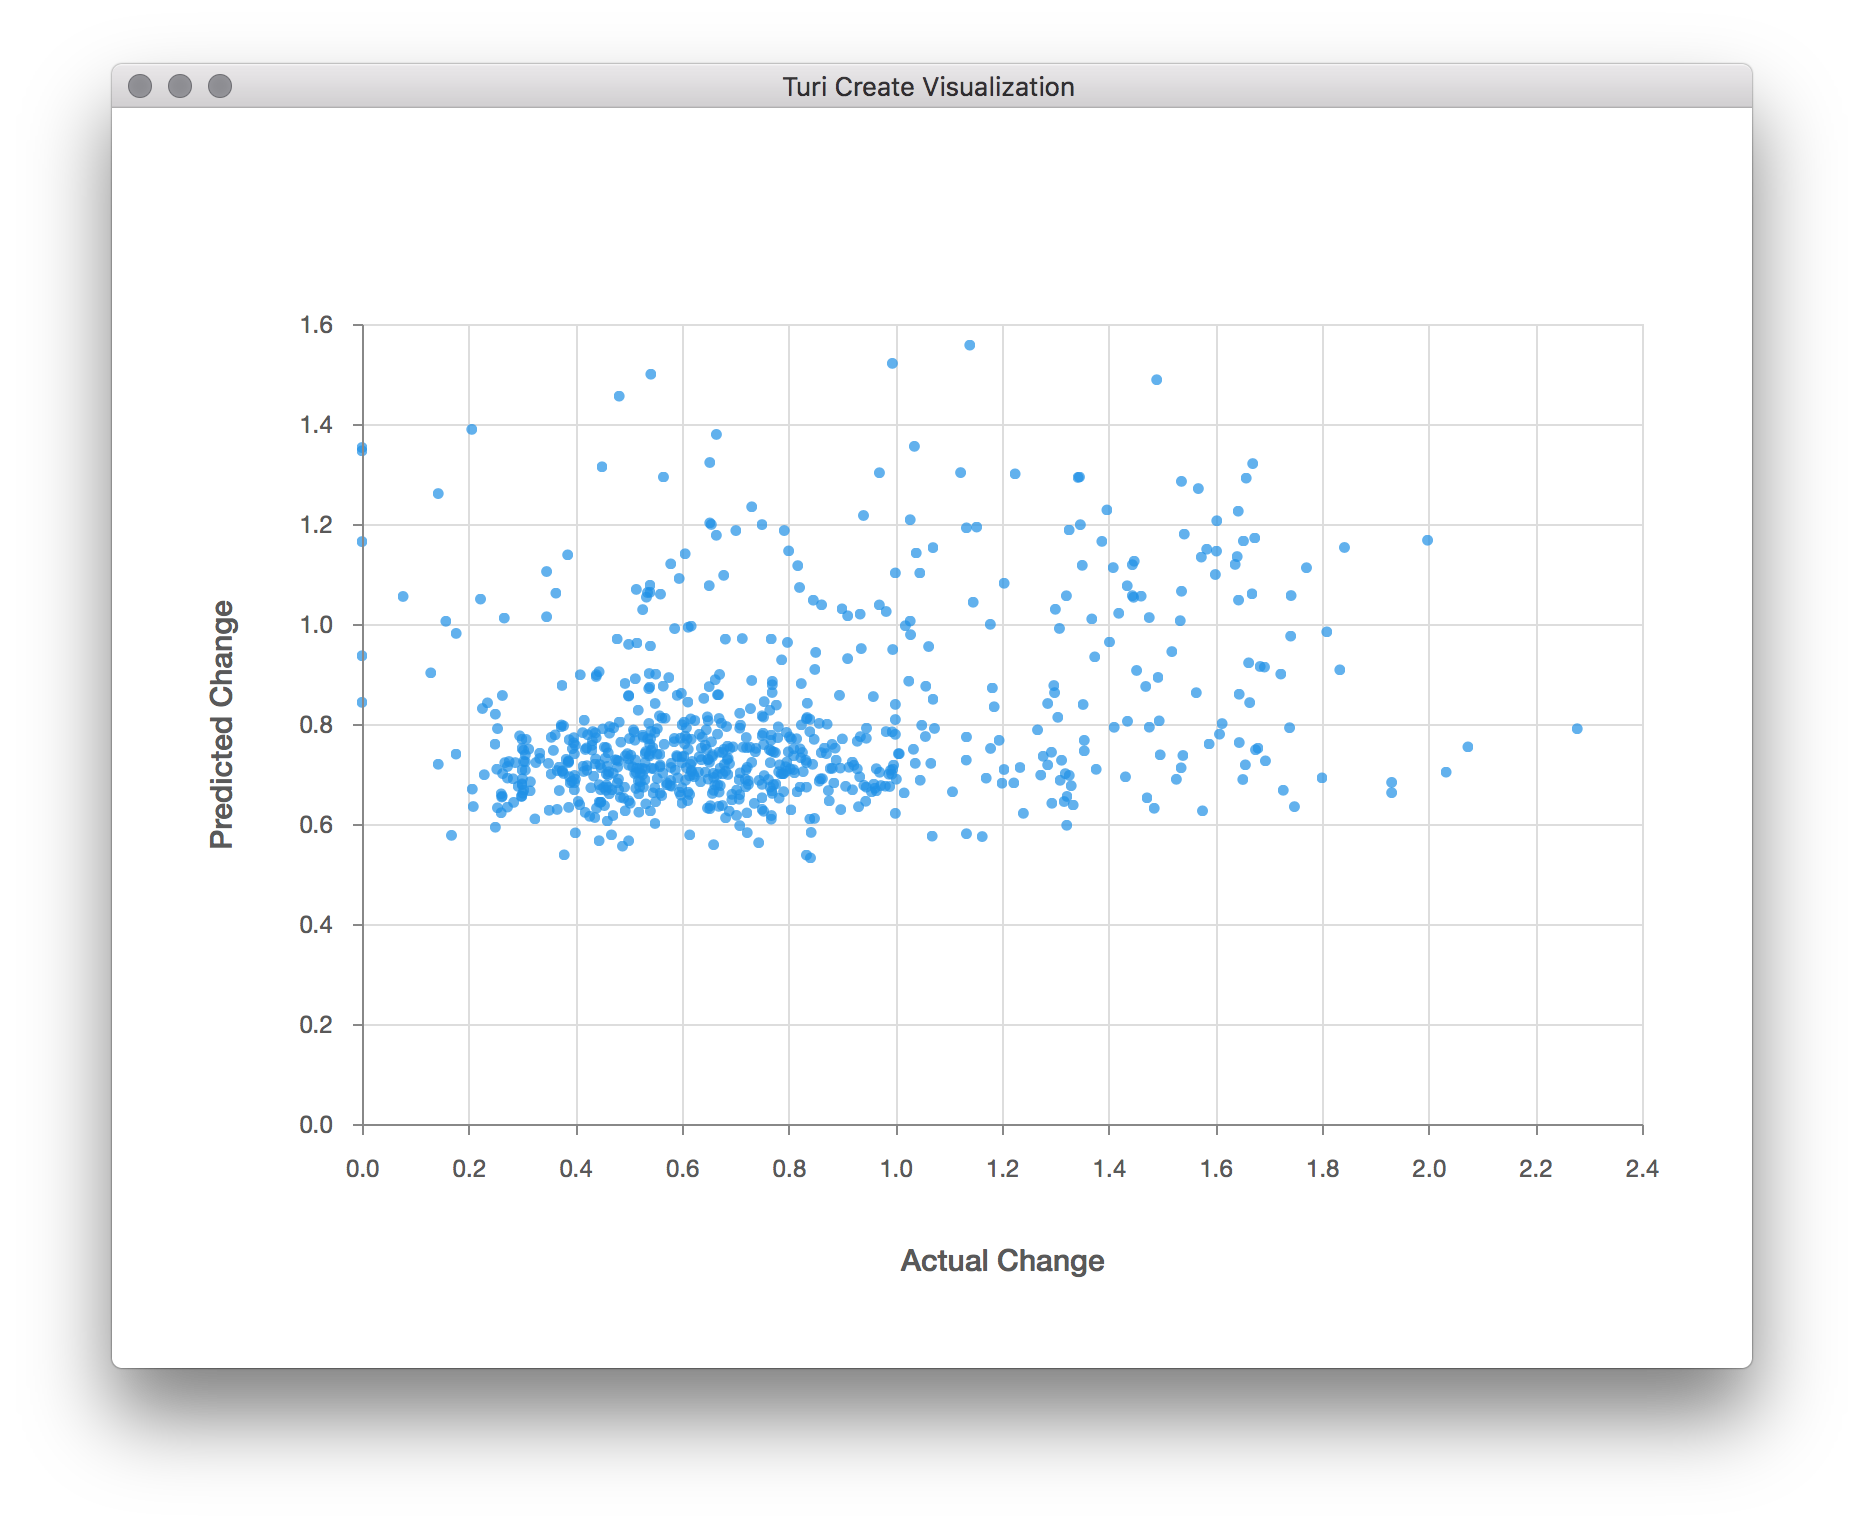
Scatter plot
# Assumes `sa1` and `sa2` are both numeric (int/float) SArrays <= 5,000 rows
turicreate.show(sa1, sa2, xlabel='Actual Change', ylabel='Predicted Change')
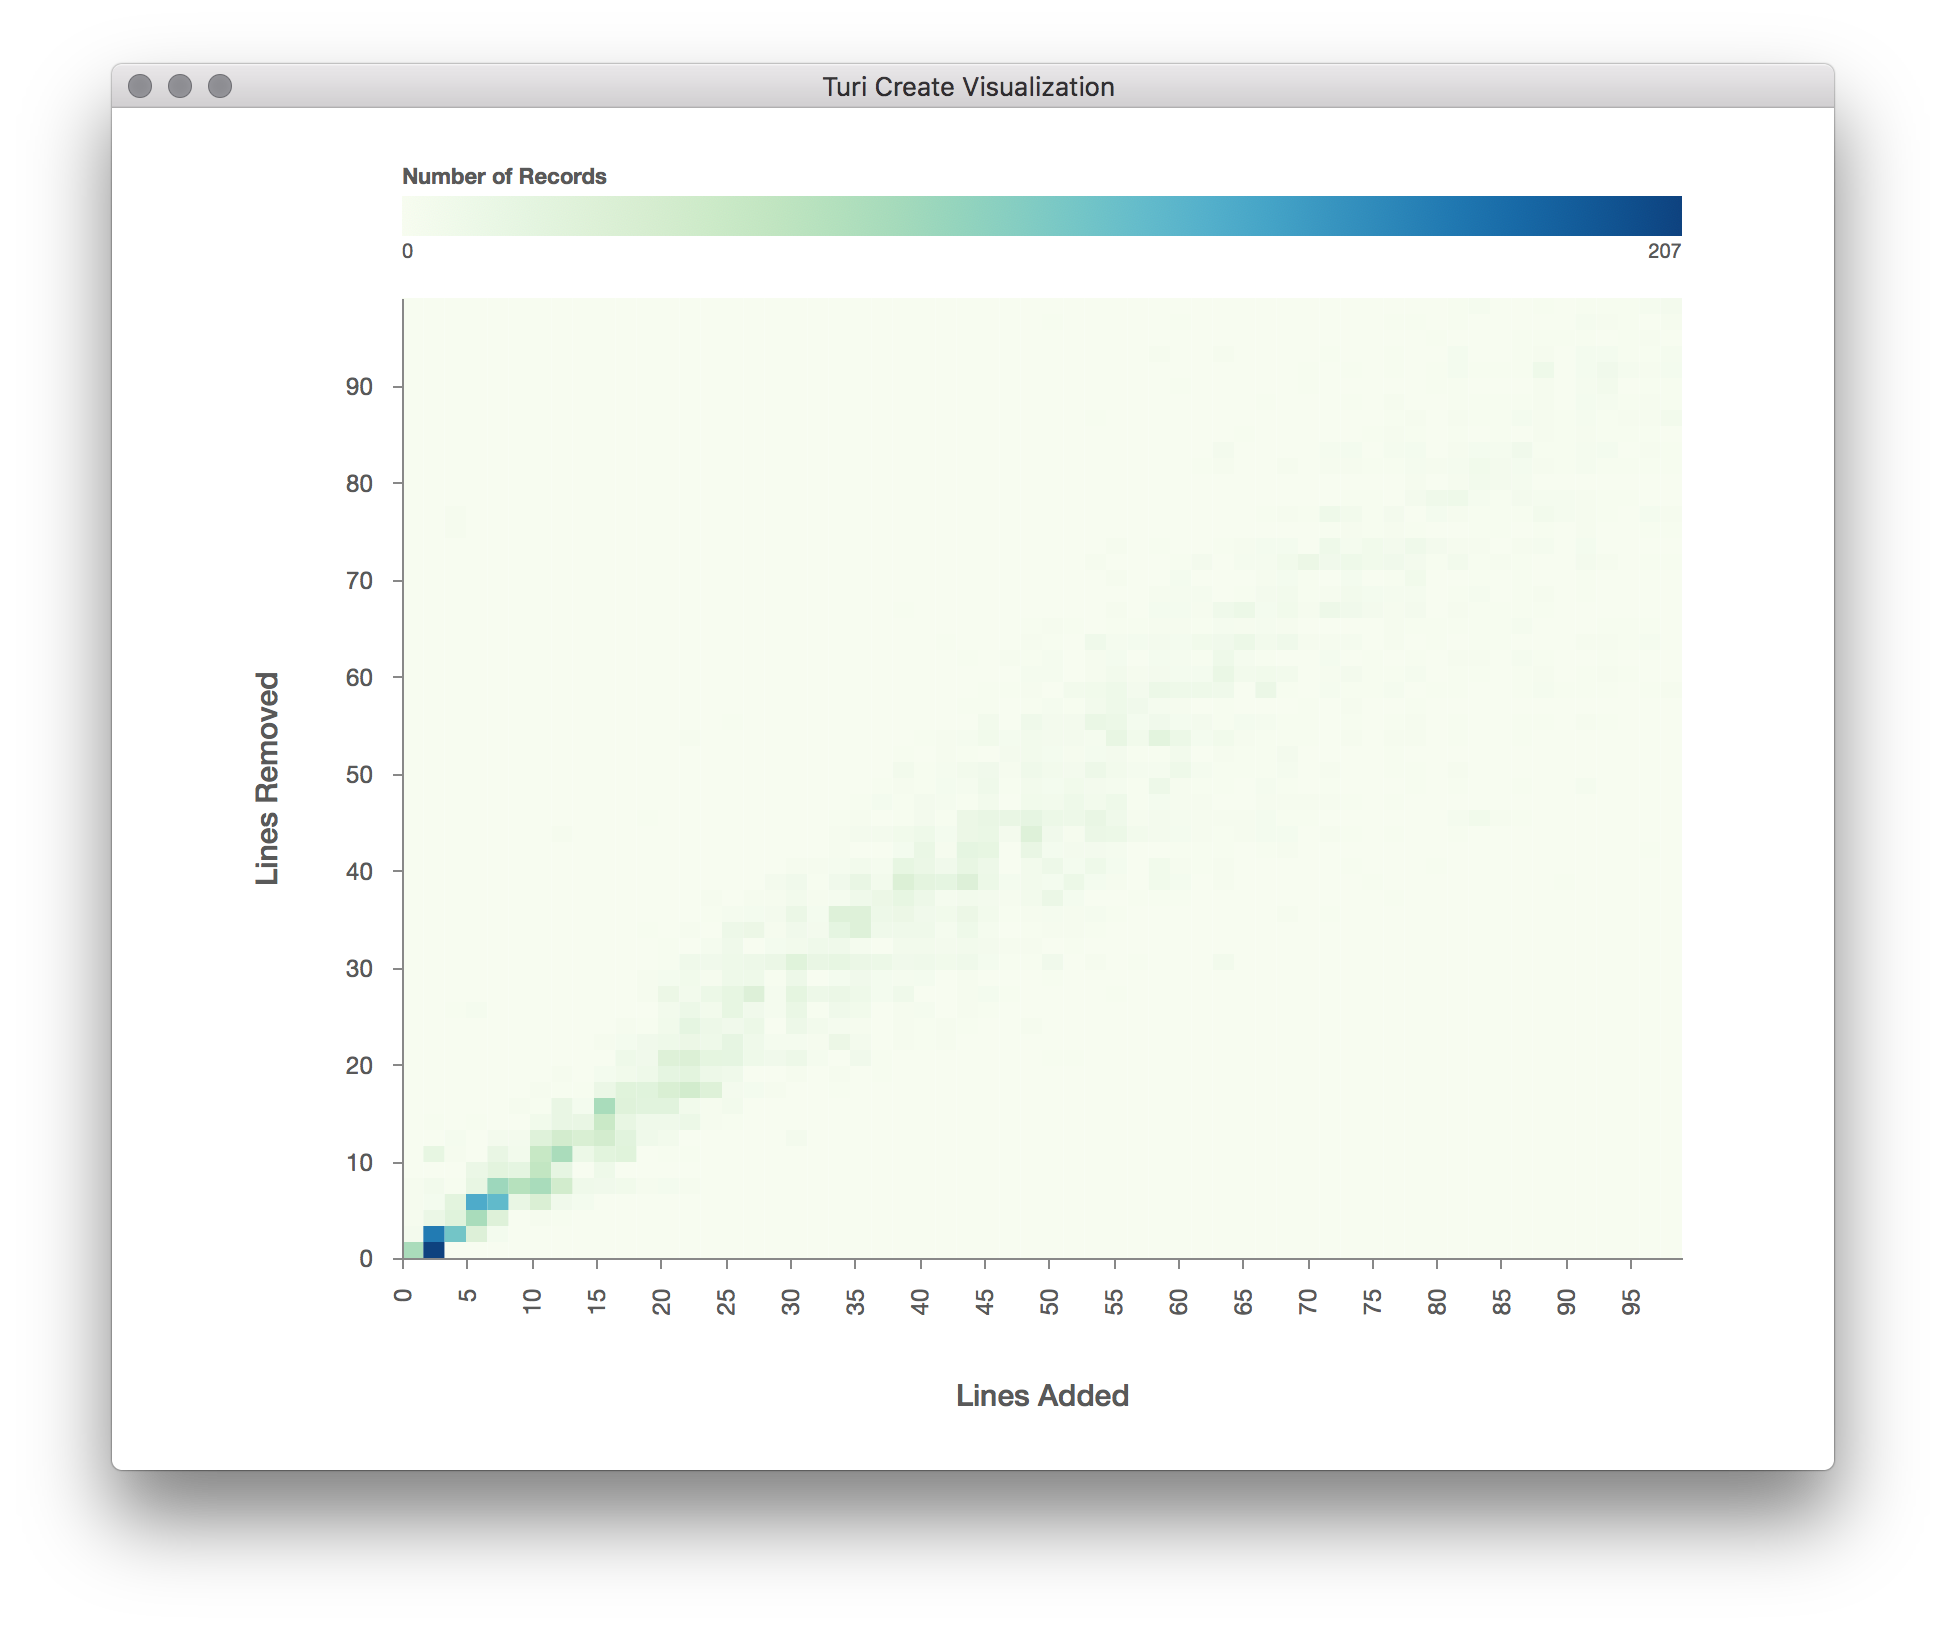
Numeric heat map
# Assumes `sa1` and `sa2` are both numeric (int/float) SArrays > 5,000 rows
turicreate.show(sa1, sa2, xlabel='Lines Added', ylabel='Lines Removed')
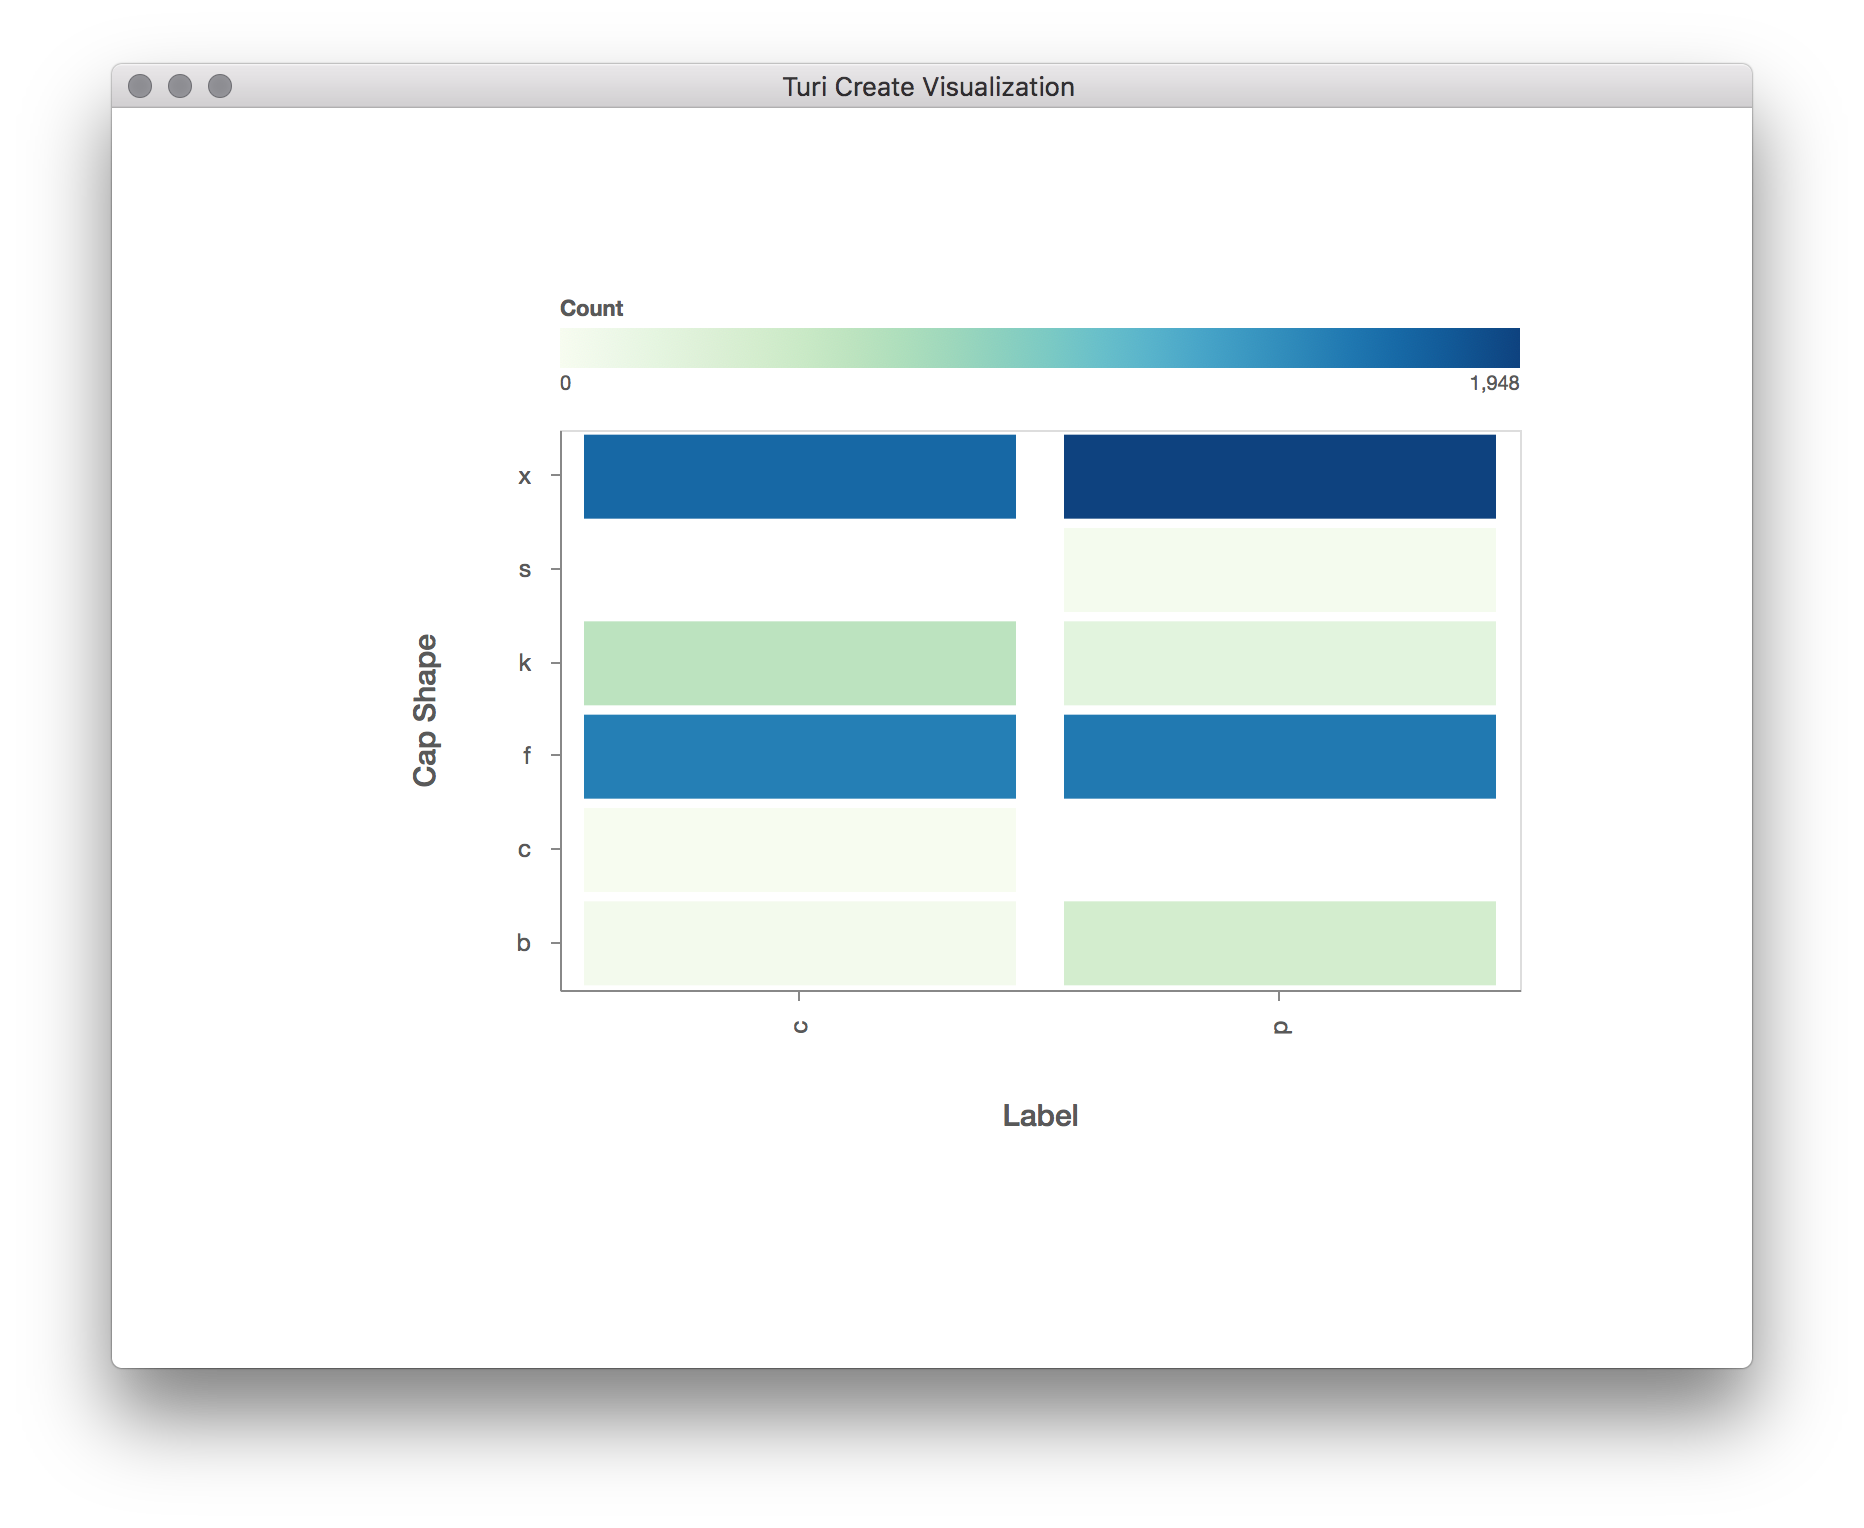
Categorical heat map
# Assumes `sa1` and `sa2` are both categorical (str) SArrays
turicreate.show(sa1, sa2, xlabel='Label', ylabel='Cap Shape')
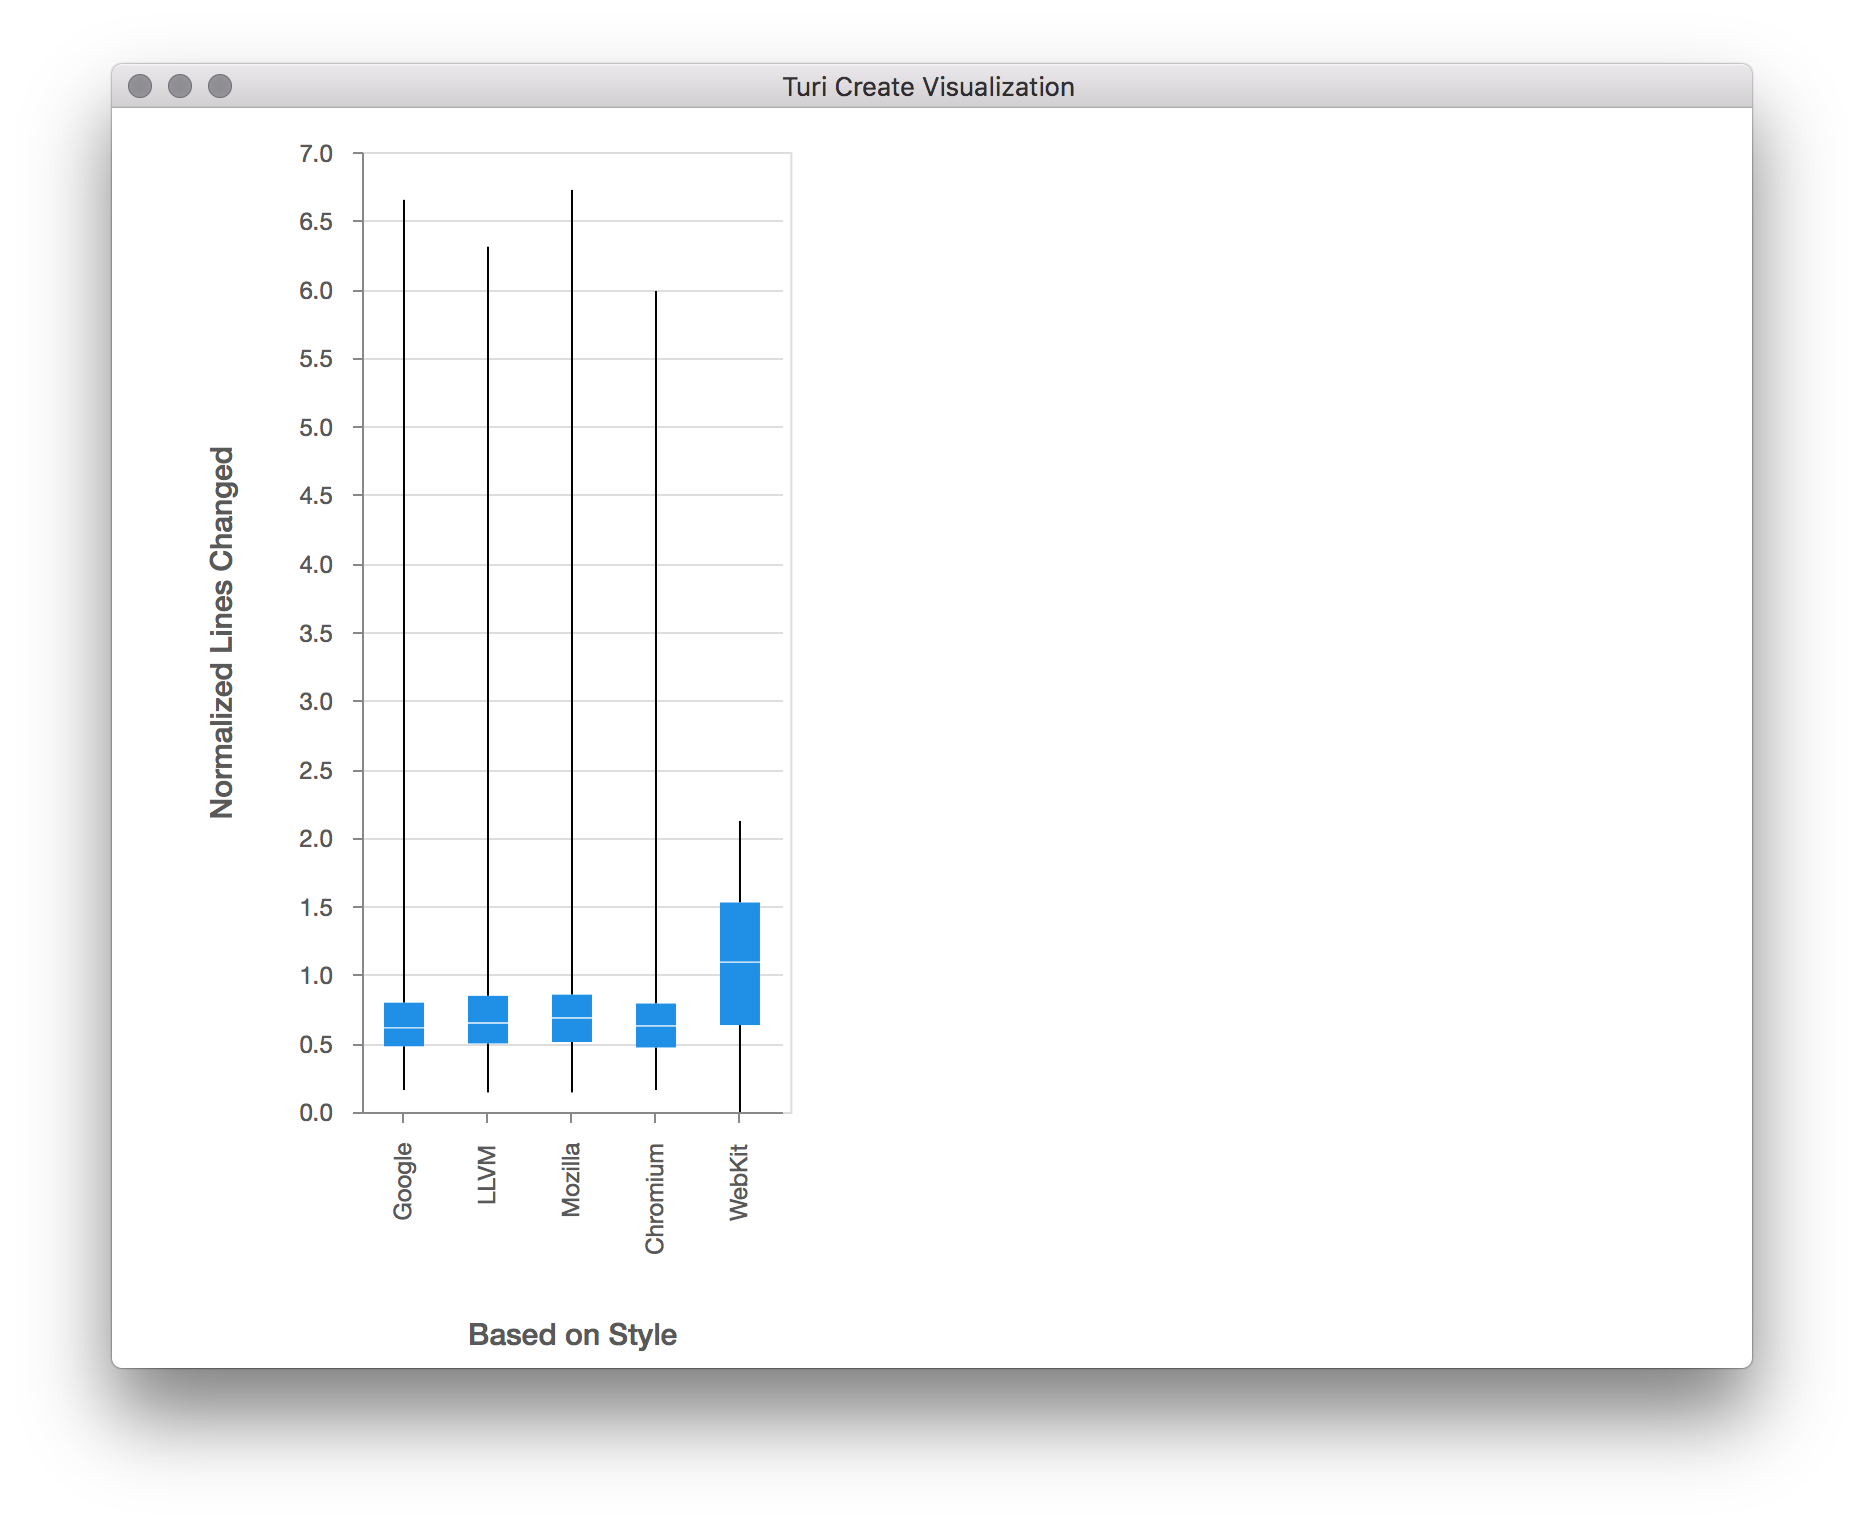
Box plot
# Assumes `sa1` is numeric (int/float) and `sa2` is categorical (str),
# or alternatively, `sa2` is numeric and `sa1` is categorical.
turicreate.show(sa1, sa2, xlabel='Based on Style', ylabel='Normalized Lines Changed')